1991 Revisited
At the end of February, you could categorize the 1991 California winter as abysmal. There was practically no snow. Ski resorts featured the dreaded brown ribbon – which is about as much fun as it sounds – a thin, brown streak of ‘snow’ that offers one of the few paths down the mountain. More concerning than recreation, reservoirs were severely low so the ability to meet urban and agricultural water needs were looking grim. It was a dire situation. Then March came in and a conveyer belt of storms began battering California. By the end of the month, the state’s water supply had been rescued and the subsequent rafting season was excellent. March Miracle had been born.
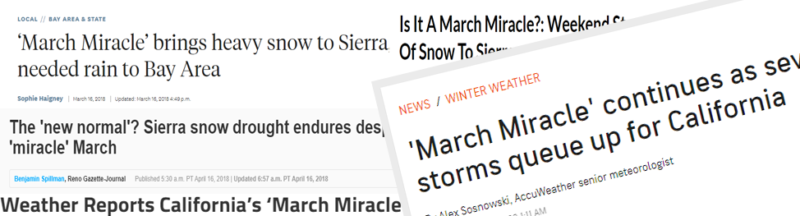
2018 March Miracle
Fast forward to 2018, and once again the dreaded brown ribbon was back. By the end of February, the snowpack was trailing the worst winter on record which was just set a few years prior in 2015. Then March came in and the storm spigot turned on, once again saving the season. It was dubbed another March Miracle. But was it the same miracle of 1991? Let’s look at the data and see what we find.
California has a graphing tool that can plot out snowpack by selecting desired years. Unfortunately, this tool doesn’t go back far enough for us to examine 1991, so we will have to dig into the numbers manually. Good thing I have plenty of time with quarantine. There are tons of snow sensors in California, so we’ll cheat a little bit and only look at a handful of well known rivers and their highest elevation snow sensor. To keep this relevant to the Kern River though, we’ll look at every snow sensor in our drainage.
SWE: Snow Water Equivalent. The measurement that answers the question of how much water will you get when you melt this snow? Read more here.
After that, we’ll record the average SWE (snow-water equivalent), and then the SWE change for March, 1991. (For a quick read on what SWE is, I wrote about it here.) This will give us the criteria for the original March Miracle. Finally, we’ll then compare this to the 2018 season snowpack to see if this benchmark was met and if we really did unlock a miracle.
And here is what we get:
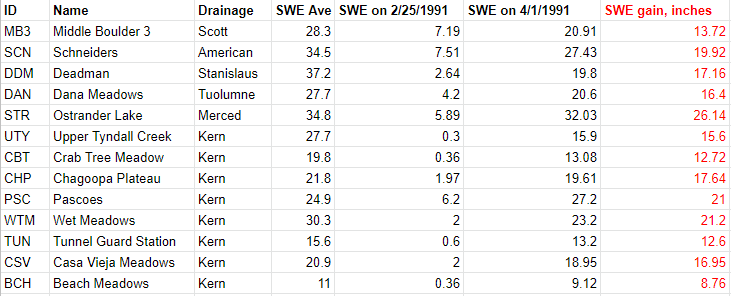
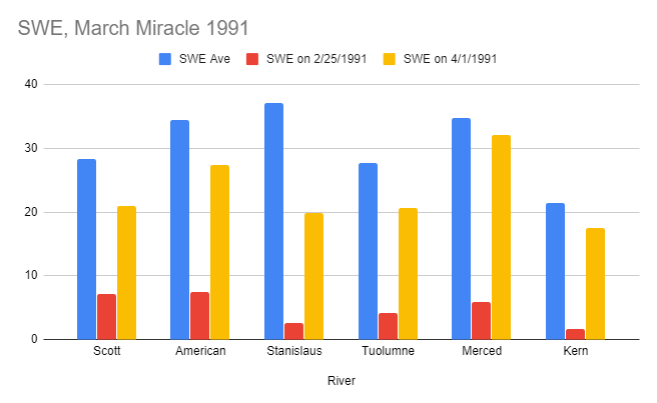
A couple of items to point out. The first being my date range begins on 2/25 and not 3/1. The reason being is after I looked at the data, I could see there was significant change starting towards the end of February, so I wanted to capture SWE pre-storm activities. I have it ending on 4/1 because historically that is when the final snow survey is measured as that is typically the date when snowpack is the deepest. What’s also interesting is while March delivered huge numbers, it still technically ended up being a below-average winter for most of the locations. I really doubt anyone was complaining though seeing that many locations were starting sub 10% of normal.
Most importantly, it’s easy to see why this March was dubbed a Miracle. Some stations reported nearly an entire winters worth of SWE in just a month, which is like having 11 months of summer and then a single month deluge of winter. For example, Chagoopa Plateau started at a meager 9% of average and then diligently marched to 90% of average. That’s echoed well with Casa Vieja Meadows, which registered a 10% snowpack and then climbed to 91%. Others are more modest but still impressive, such as Middle Boulder 3, swinging from 25% to 74% of normal.
Now that we have a March Miracle yardstick, let’s examine March 2018.
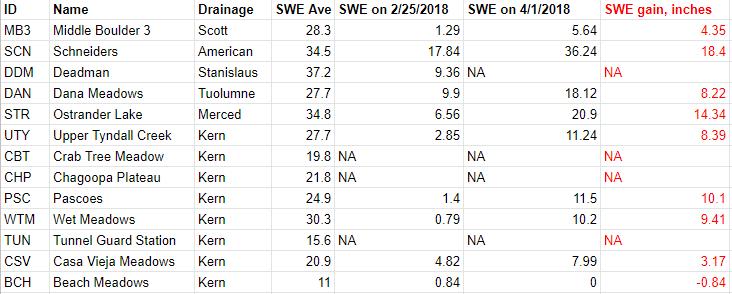
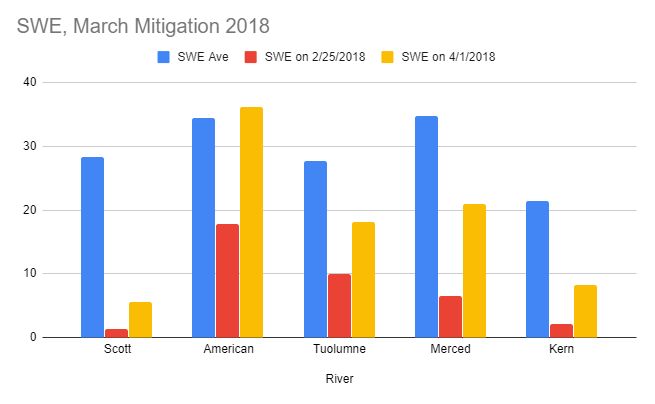
We’re missing a bit of data here, but it’s still evident that while March 2018 was a strong month, as a whole, it didn’t quite hit ‘miracle’ status of 1991. For anyone that hangs around meteorology forums (just me?), you’ll probably recall that this was dubbed March Mitigation, a nod to the exceptionally strong finish but not deficit erasing heroics. You could extrapolate that the Kern River had lower flows that season compared to the other rivers, however, this ended up not being the case. We were fortunate to have dam maintenance that summer, which meant they had to drain the lake, releasing far more water on the Lower Kern than they normally would over June, July and August. Paired with March Mitigation, this bumped up flows considerably and we had a good whitewater season.
Everyone loves a good comeback story and March Miracle is no exception. Sure, from the numbers 2018 didn’t quite hit the mark, but it did save the season and in my book, that’s all that matters. A miracle indeed.